

, a division of the National Health Laboratory Service, continues to provide laboratory-based surveillance to inform the public health response towards COVID-19 in South Africa. Today the institute reports 942 new COVID-19 cases that have been identified in South Africa, which brings the total number of laboratory-confirmed cases to 2,913,880. This increase represents a 2.4% positivity rate. As per the National Department of Health, a further 37 COVID-19 related deaths have been reported, bringing total fatalities to 88,466 to date.")
Today the National Institute for Communicable Diseases (NICD) reports 942 new COVID-19 cases that have been identified in South Africa, which brings the total number of laboratory-confirmed cases to 2,913,880. This increase represents a 2.4% positivity rate. As per the National Department of Health, a further 37 COVID-19 related deaths have been reported, bringing total fatalities to 88,466 to date.
18,055,424 tests have been conducted in both public and private sectors as per the table below.
| Sector | Total tested | New tested | ||
| PRIVATE | 9,731,977 | 53.9% | 18,874 | 48.4% |
| PUBLIC | 8,323,447 | 46.1% | 20,095 | 51.6% |
| Total | 18,055,424 | 38,969 |
PROVINCIAL BREAKDOWN
The majority of new cases today are from Western Cape (23%), followed by Gauteng Province accounting for 18%. KwaZulu-Natal accounted for 15%; Free State accounted for 11%; Eastern Cape and Northern Cape each accounted for 10% respectively; North West accounted for 6%; Mpumalanga accounted for 5%; and Limpopo accounted for 1% of today’s new cases. The cumulative number of cases by province is shown in the table below:
| Province | Total cases for 12 Oct 2021 | Adjusted numbers after harmonisation | Updated total cases on 12 Oct 2021 | New cases on 13 Oct 2021 | Total cases for 13 Oct 2021 | Percentage total |
| Eastern Cape | 291,622 | 0 | 291,622 | 94 | 291,716 | 10.0 |
| Free State | 162,411 | 0 | 162,411 | 103 | 162,514 | 5.6 |
| Gauteng | 917,900 | 0 | 917,900 | 172 | 918,072 | 31.5 |
| KwaZulu-Natal | 513,874 | 0 | 513,874 | 142 | 514,016 | 17.6 |
| Limpopo | 122,045 | 0 | 122,045 | 9 | 122,054 | 4.2 |
| Mpumalanga | 151,423 | 0 | 151,423 | 50 | 151,473 | 5.2 |
| North West | 150,067 | 0 | 150,067 | 59 | 150,126 | 5.2 |
| Northern Cape | 91,658 | 0 | 91,658 | 93 | 91,751 | 3.1 |
| Western Cape | 511,938 | 0 | 511,938 | 220 | 512,158 | 17.6 |
| Unknown | 0 | 0 | 0 | 0 | 0 | 0.0 |
| Total | 2,912,938 | 0 | 2,912,938 | 942 | 2,913,880 | 100.0 |
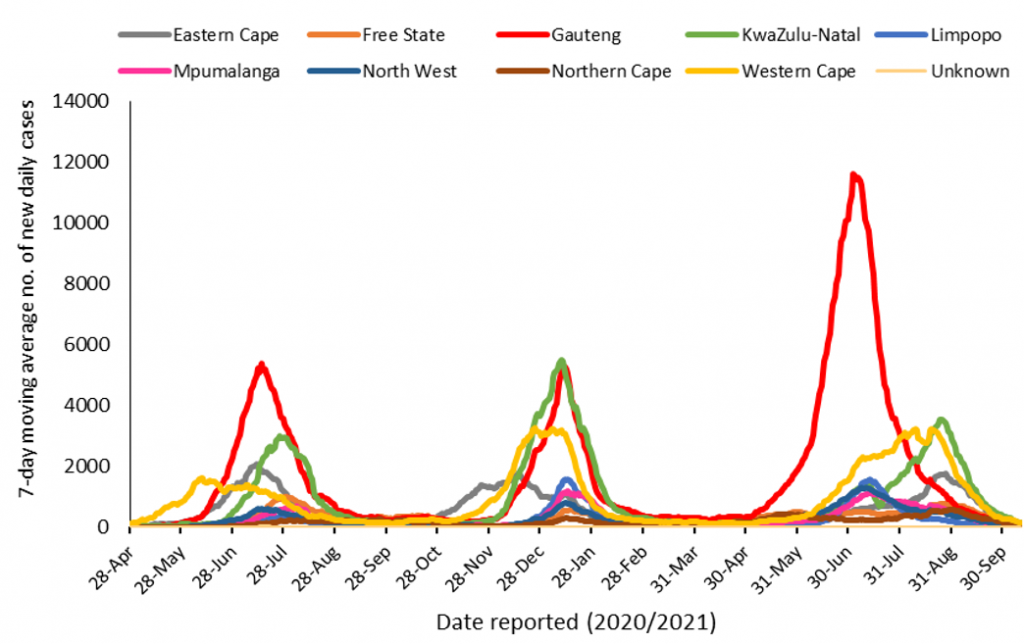
THE 7-DAY MOVING AVERAGE NUMBER OF NEW CASES BY PROVINCE
The total number of cases today (n= 942) is higher than yesterday (n= 592) and higher than the average number of new cases per day over the 7 preceding days (n= 730).
For more detailed information, visit the GIS Dashboard.
HOSPITAL ADMISSIONS
There has been an increase of 70 hospital admissions in the past 24 hours. The following table is a summary of reported COVID-19 admissions by sector.
| Sector | Facilities Reporting | Admissions to Date | Died to Date | Currently Admitted |
| Private | 258 | 199,994 | 36,877 | 3,029 |
| Public | 408 | 232,412 | 56,657 | 2,169 |
| TOTAL | 666 | 432,406 | 93,534 | 5,198 |
VACCINE UPDATE
For updates on the national vaccine programme, click here